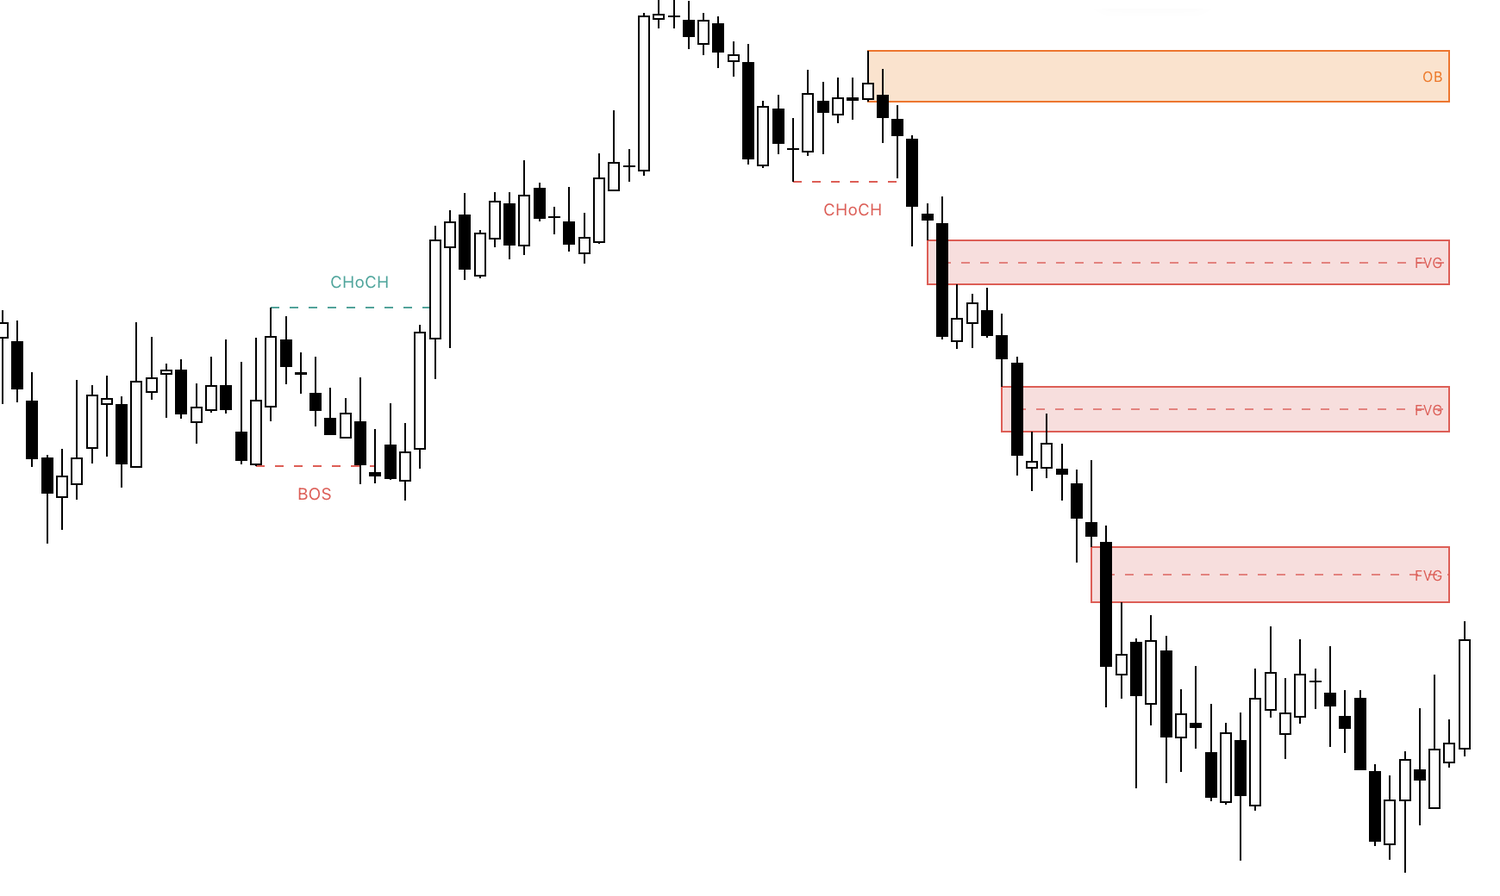
One indicator draws break of structure, change of character, order blocks, fair value gaps and equal highs and lows, with the 50% midpoint and a stats table for your own chart. You paste it once. The 57-page guide that explains every mark comes free.
Get the indicator
This is what the indicator puts on your chart, one detail at a time. The bonus guide explains each mark the same way.
A Pine Script v6 indicator for TradingView. Paste it into the Pine Editor once and it works on any chart with candles.
| Bullish | Bearish | |
|---|---|---|
| Finished gaps | n/a | n/a |
| Touched | n/a | n/a |
| Reached midpoint | n/a | n/a |
| Far edge reached | n/a | n/a |
| Inverted | n/a | n/a |
Smart money concepts have no official standard, so tools disagree. The guide gives the rule behind each mark: 5 candles on each side for a swing, a candle close for a break, 0.5 x ATR as the smallest gap.
Only the last 300 bars are drawn, with at most 5 gaps and 2 order blocks per side on screen. Every limit is a setting you can change.
The table shows how many gaps on your chart were touched, reached the midpoint or were closed through, so you can test a claim on your own data.

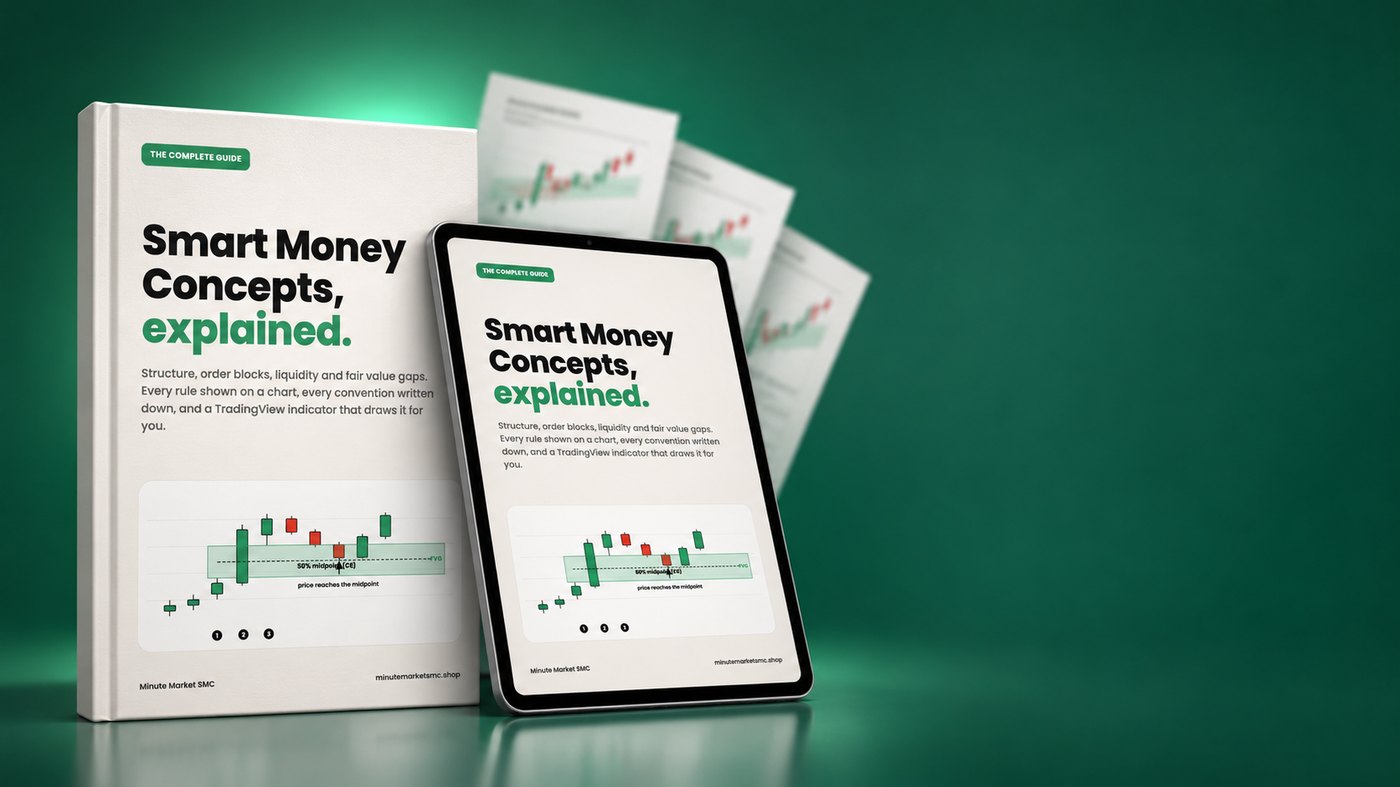
The complete guide to smart money concepts. It explains every mark the indicator draws, so you know what you are looking at. The full indicator code and the install steps are on the last pages.
What SMC is, what it is not, and why every rule is called a convention.
Swing highs and lows, and how they define a trend.
The two structure breaks, how to tell them apart, where teachers disagree.
Equal highs and lows, sweeps, and what a chart can and cannot show.
Strong moves and the 50% line of a range.
How the block is picked, how it is removed, and the common mistakes.
The hole between three candles, drawn with wicks, not bodies.
Standard, midpoint, edge, inversion, implied, BPR, breakaway, first presented.
A reading routine for a chart, with a checklist.
How to read the dashboard and keep a journal that does not lie to you.
What the sources themselves warn about.
Plain-language definitions, A to Z.
Step by step, with fixes for the usual errors.
The full Pine Script v6 file, ready to paste.
It draws structure breaks, order blocks, fair value gaps and equal highs and lows on your chart, and fills a table with how the gaps on that chart behaved. What you do with the marks is your call.
No. It runs on a free account. Free plans limit how many indicators one chart can hold.
Any chart on TradingView that has candles. The table describes only the chart, timeframe and settings you are looking at.
There is no official standard for these concepts. The guide lists the exact rules this indicator uses, so you can compare.
No. It is a charting tool and a guide. Trading carries a high risk of loss.